
Chrome DevTools
充分利用好 Chrome DevTools ,对前端的开发、调试、部署帮助非常大。
Debug element that is removed on blur
Rightclick the node in element tree -> Break on... -> Node removal
https://stackoverflow.com/questions/24287721/examine-element-that-is-removed-onblur
Debug on hover
- Focus on
Sourcesfile by clicking there - Move mouse pointer to hover on an element
- Press F8
F8 pauses script execution
Debug popups, modals and animations
- Open DevTools
- Open Console tab
- Paste following, then hit Enter:
setTimeout(function() { debugger; }, 5000)
- Navigate to your popup and wait in 5 seconds, the debugger will pause the page, and you can see your code
https://medium.com/@mitchwd/debugging-popups-modals-animations-e833856d80a9
Sources Panel Overview
查看源文件
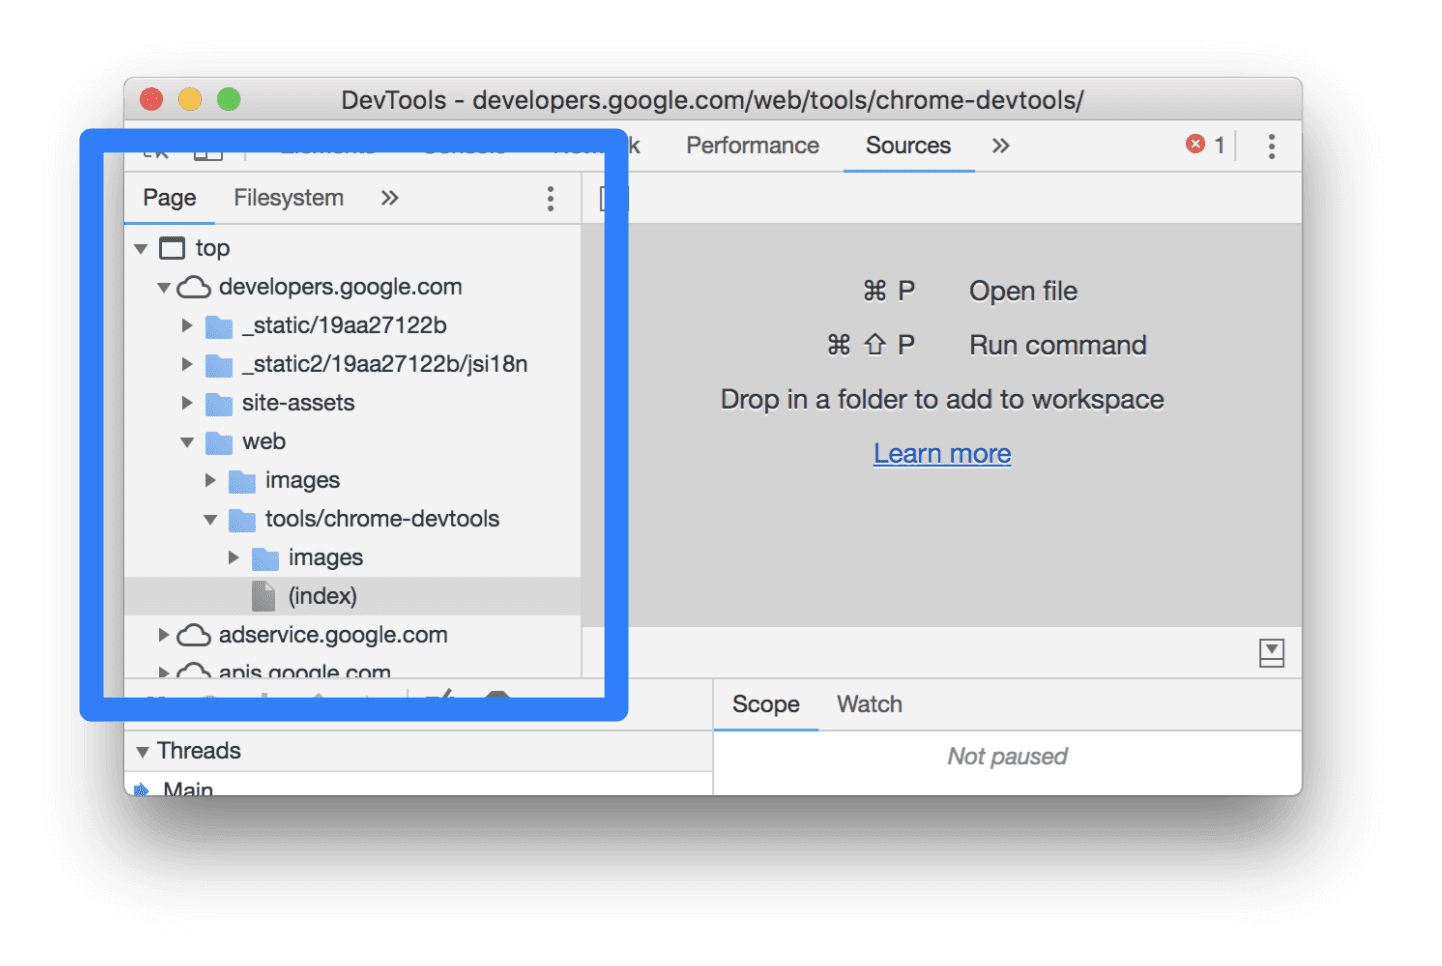
Page 侧边栏窗口, 可以浏览页面用到的源文件
-
The top-evel, such as
top:an HTML frame, main document frame -
The second-evel, such as
developers.google.com: an origin -
The third-level, fourth-level, and so on: directories and resources that were loaded from that origin
搜索打开,快捷键: ctrl + p
编辑 CSS 和 JavaScript
Editor 编辑器窗口,可以编辑 CSS 和 JavaScript 源文件
CSS
编辑 CSS 文件后会立即在页面生效
JavaScript
编辑 JavaScript 文件后,需要先保存 Command+S or Ctrl+S. DevTools 不会重新执行代码。只有函数内部的改动,当对应事件触发被重新调用时才会生效。
Workspace
默认刷新页面后源文件的改动会丢失。使用 Workspace 可以保存 CSS,JavaScript 的改动到本地文件。
创建、保存、执行代码片段
Snippets 窗口,点击底部的Run按钮
Performance
调试 DevTools
可以在 DevTools 中再新开一个 DevTools,查看原 DevTools 的所有开发信息
-
DevTools 菜单
Undock into separate window -
按下 DevTools 的快捷键,例如 ctrl + shift + i